
Our favorite type of client? One that has been growing so fast they haven’t had time to really put their financial reports to work. There is so much room for improvement in a company that is already growing but doesn’t yet know how to glean value from their financial reports.
Sure, you look at your P&L, balance sheet and budget vs. actuals each month (you do, right?)… but what are you doing with those reports?
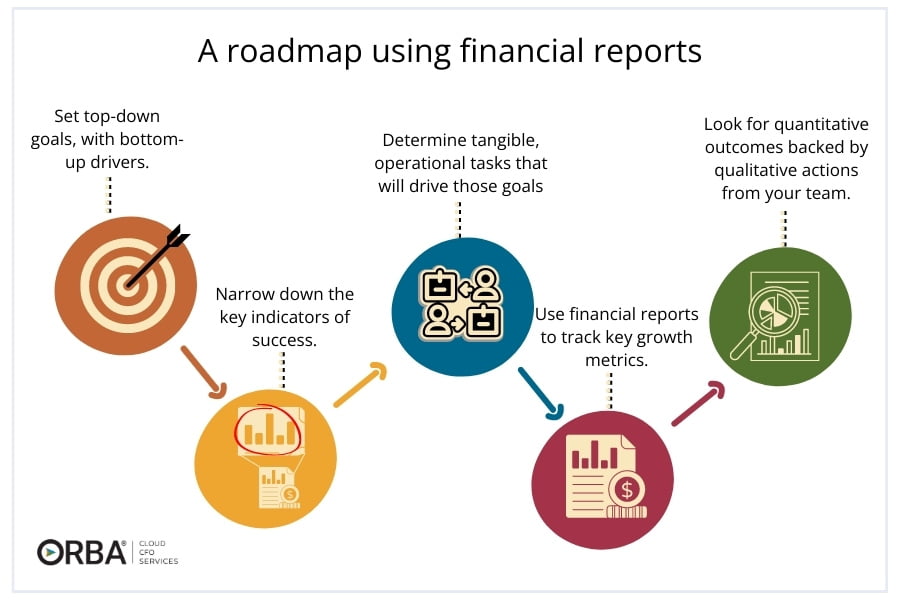
When you set financial goals for your company, it’s crucial to have a way of measuring your progress. Otherwise, it’s like taking a road trip but ignoring the highway signs (or your trusty GPS). In business, think of your financial reports as your trusty highway signs.
3 Examples of How to Use Your Financial Reports
1). Get your managers involved.
Step one, to put your financial reports to work involve your team and curate a culture for growth. Be transparent with your numbers so your team can learn how they can control and affect your financials. By involving the relevant department managers, you can increase tactical decision-making, collaboration and buy-in.
For example, if you set out to increase revenue by 20% how are you allocating resources?
Now, you could just leave that decision to your sales department and hope for the best. But why leave it to chance when you can arm your sales team with data-driven reports?
These financial reports will reveal metrics that matter – like which product is killing it, which clients could use some extra love, and which service has the highest profit margin. Armed with this knowledge, your sales team will know exactly where to focus their efforts, and you’ll have the perfect indicators to track progress. Backed by accurate financial reporting, your team can tease out tangible goals to meet your objectives.
If you’re a salesperson you can’t control whether the revenue doubles in the current year, but a salesperson can control how many cold calls they make each day. They can control the inputs that will result in the financial outcome you want to see. Do these touch-points have value to your key initiatives? If not, prioritize ones that do.
- Educate your team: on how to read financial reports. Start with the P&L statement first- money in, money out- then move on to the balance sheet.
- Make reports available: to your team so they can optimize costs, properly forecast, and budget per line item. Streamline this process with this month-end closing checklist.
- Make it easy: to read the reports. We recommend internal reports with simplified financials.
- Offer incentives: for hitting the targets you’ve budgeted for. Put a name next to each P&L and Balance Sheet account to create ownership and accountability.
Offering transparency about financial reports facilitates a paradigm shift where managers will no longer be pestering employees to work harder, instead, highlighting missed rewards. The focus is on opportunities, not threats.
If you’re a manufacturing company, for example, bring in your warehouse manager in charge of all employees that fulfill orders, and teach that manager how to read and track those labor costs, i.e., direct labor on the P&L statement. Offer incentives for hitting certain benchmarks. The manager can then focus on making her team more efficient. E.g., by sending out more shipments with the same amount people. Your company is now operating more efficiently, you’ve reduced labor costs and your manager can track that success themselves; plus, they receive compensation for helping the company scale. Win, win.
2). Optimize reports using integrated cloud solutions.
Put your financial reports to work by integrating and automating your systems as much as possible. You can then access data you need in real-time and rely less on Excel. One of the biggest value-adds of integrated systems is having live dashboards of data that lets you know, to the minute, how the business is doing. Not just dashboards that give you the big picture, but interactive dashboards hyperlinked to drill-down on the details of those metrics to give you a better understanding of your company health.
Here’s a great example: Let’s imagine a SaaS business tracking a recurring revenue metric from last month compared to the current month. On an integrated dashboard, they can drill-down directly to the recurring numbers and get detailed insight into customer success KPIs like customer acquisition, retention and churn.
If your company is on the smaller side, integration might include a few different cloud solutions synced to reduce data entry but still provide you real-time access to expense reports or outstanding accounts receivable. If your business is larger, you may find value by making the switch to NetSuite, a more robust solution for companies with large inventories or those who need consolidated financials.
“Now data is accessible. To drive growth- especially our marketing efforts- having data is not an option, it’s an absolute necessity.”
Habib Salo, CEO Young Nails
3). Use your data to scale.
You can’t grow what you don’t know. (It rhymes and it’s cheesy but it’s true). How can you prepare for growth if you don’t have the tools to do so? Growth ratios tell you how fast your business is growing. For example, we know we need to hire one new person to our Cloud CFO team for every four new clients we hire.
Do you know your CAC? How many new hires do you need to make per acquired customer? We love a forward-thinking approach to financials and these benchmarks can help you make better business decisions for your future.
For instance, a nonprofit that operates a fund knows that for every 20 grants they offer, they need to hire one new program manager to oversee appropriate spending and use of grants by the recipients. In a non-profit world where they want to offer more impact they know exactly how much capacity they have to provide more funding and services by using their financials to chart their future. They can easily link their metrics to their mission.
No matter your industry, if you’re not squeezing your financial reports for all they are worth you’re missing a huge opportunity to set your business up to scale.
Need help setting your reports up to shine or knowing which type of incentives to offer? Start a conversation with us today.