We often see prospective clients paying special attention to the profit and loss statement (P&L), but ignoring the balance sheet. That’s a mistake, as both are important. Let’s drill into the difference between the P&L and balance sheet with this cheat sheet:
The Profit and Loss Statement
A P&L statement reports on:
- Revenue
- Cost of Goods Sold
- Expenses
- Profits
The P&L depicts a period of time summarizing operations. It’s also referred to as the income statement.
When to use the P&L statement?
The P&L statement is useful for review of profit or loss over a certain interval of time (e.g. monthly, quarterly, annually). As a stand-alone report it only tells part of the story, but when compared to a budget it gives you a valuable comparison. For instance, the P&L can show the results or trends of one period to another (e.g., 2019 versus 2018 or budget vs. actual).
Fun fact: the phrase, “the bottom line,” comes from the profit and loss statement as the bottom line records the net income, or profits.
Useful metrics on the P&L
You can find the following metrics on the income statement:
- Gross Profit = Net Sales − Cost of Sales
- Net Operating Profit = Gross Profit − Operating Expenses
- Net Operating Income = Total Revenues – Total Operating Expenses
- EBITDA (Earnings before Interest, Taxes, Depreciation, and Amortization) = Net Profit (or Loss) + Interest, Taxes, Depreciation, and Amortization.
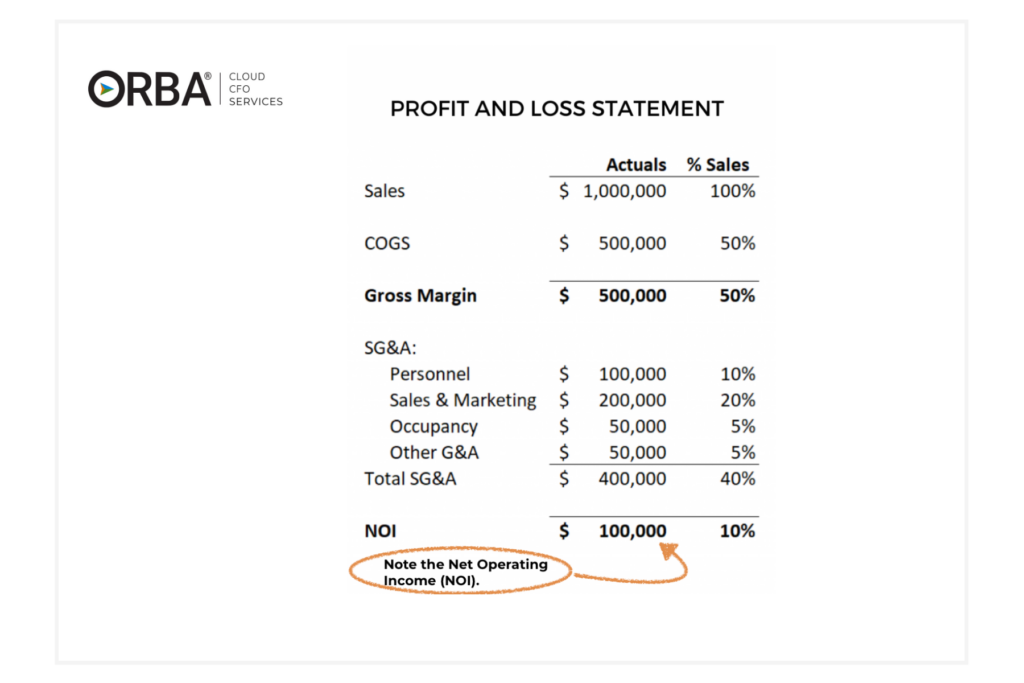
When you examine the P&L example above, it looks pretty good, showing a 10% increase in net operating income (NOI). Now let’s compare the P&L to budget to really see what’s going on with this business.
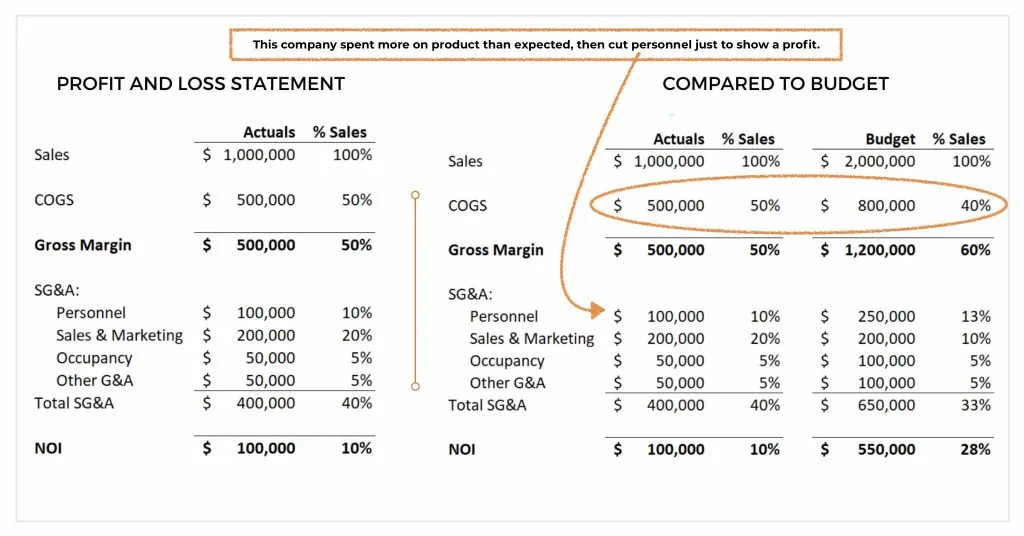
Once you compare the P&L to budget, you see this business spent more on product than they had budgeted for. They then cut personnel just to show a profit. This is the exact opposite of positioning your business to scale. Without comparing the P&L to budget you miss an integral part of the puzzle.
The Balance Sheet
The balance sheet reports on:
- Assets ( items of value like: accounts receivable, cash, inventory, property)
- Liabilities (money owed like expenses and debt: rent, loans & long-term debt, taxes, wages)
- Equity (shareholders equity, retained earnings or net assets)
- The balance sheet formula is assets = liabilities + equity.
- The balance sheet depicts a snapshot in time.
Assets = Liabilities + Equity
When to use the balance sheet?
The balance sheet is good for comparisons and understanding company value. It’s often required by lenders to obtain a loan or when you wish to apply for a business line of credit. The balance sheet report provides business financial health check ratios like the acid test or debt-to-equity ratio and tells an important story about your financials. More relevant than the compliance need, these metrics help identify trends so you can adjust operations as needed to “balance” your risk and return. Your balance sheet shows how effectively your business is turning its profits into cash. If you aren’t regularly reviewing your balance sheet our outsourced controller services may be the solution.
Related Read: Use our convenient debt to equity ratio calculator to determine your company’s financial stability.
Cloud CFO Insight: A balance sheet reconciliation is not a dump of the general ledger detail for that account. It is the transactions that exist at the end of the period that make up that ending balance for that account.
Can you calculate revenue from your balance sheet?
The answer is no. You cannot calculate revenue directly using your balance sheet. Your balance sheet reflects how you may have earned or invested revenue and should always equal zero.
“Everything that is on the balance sheet should equal zero. If it doesn’t, then you should be able to explain why.”
Jason Dion, Sr. Staff Accountant
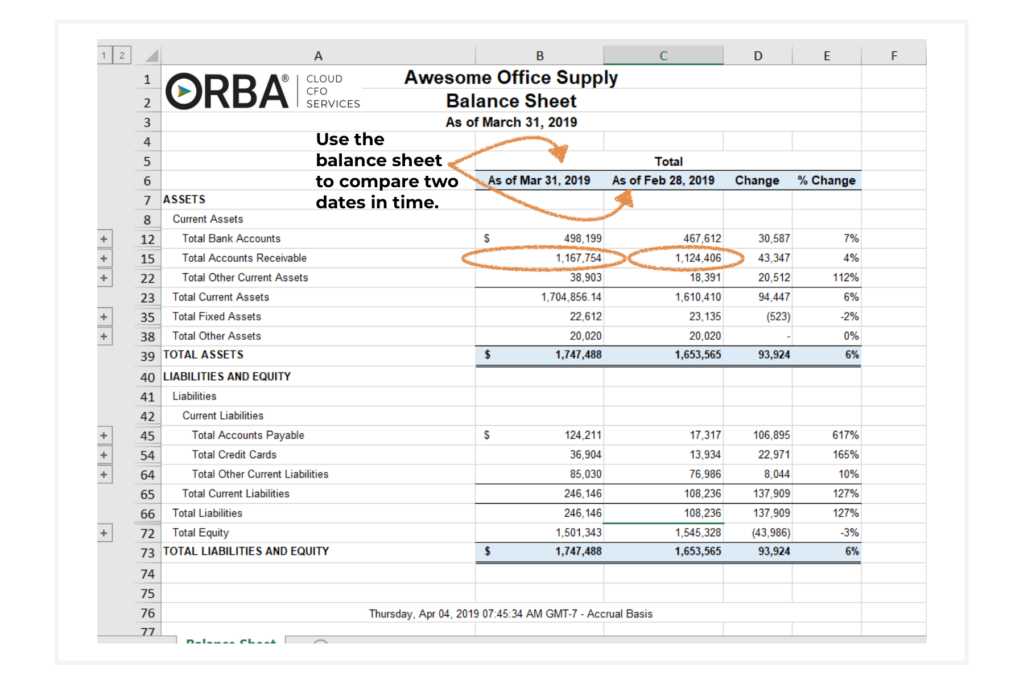
Instead you can use your balance sheet to compare how your assets have grown between two specific dates.
Useful metrics found on the balance sheet
You can find the following metrics on your balance sheet:
- Working Capital
- Current Ratio
- Quick Ratio
- Cash Conversion Cycle
- Debt-to-equity Ratio
The Balance Sheet vs. P&L
The P&L is the report to which most business owners default; however, if they wish to see their entire financial picture, the balance sheet is where they should be looking.
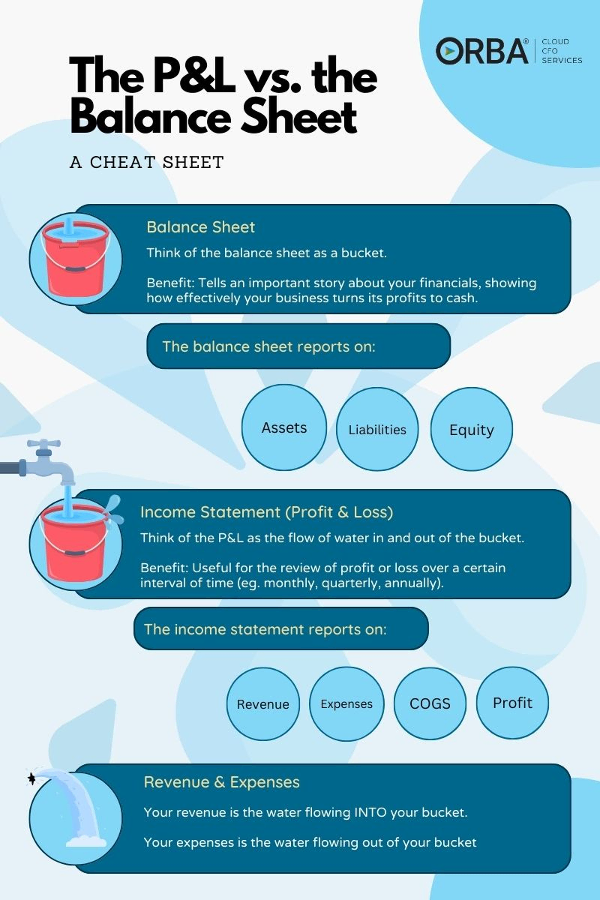
Think of the balance sheet as a bucket and the P&L as the flow of the water. The water coming from the faucet is the revenue that fills up the bucket. A hole in the bottom of the bucket is the expenses that drain out.
In the bucket analogy, the water in the bucket at any given time is the cumulative profit that the business has made so far (i.e. the equity). Your equity is the excess of assets over liabilities. Your goal should be to fill up your bucket as much as possible.
Still not clear on what the difference between the P&L and your balance sheet is? Here are a few examples:
Examples: Balance Sheet and P&L Difference
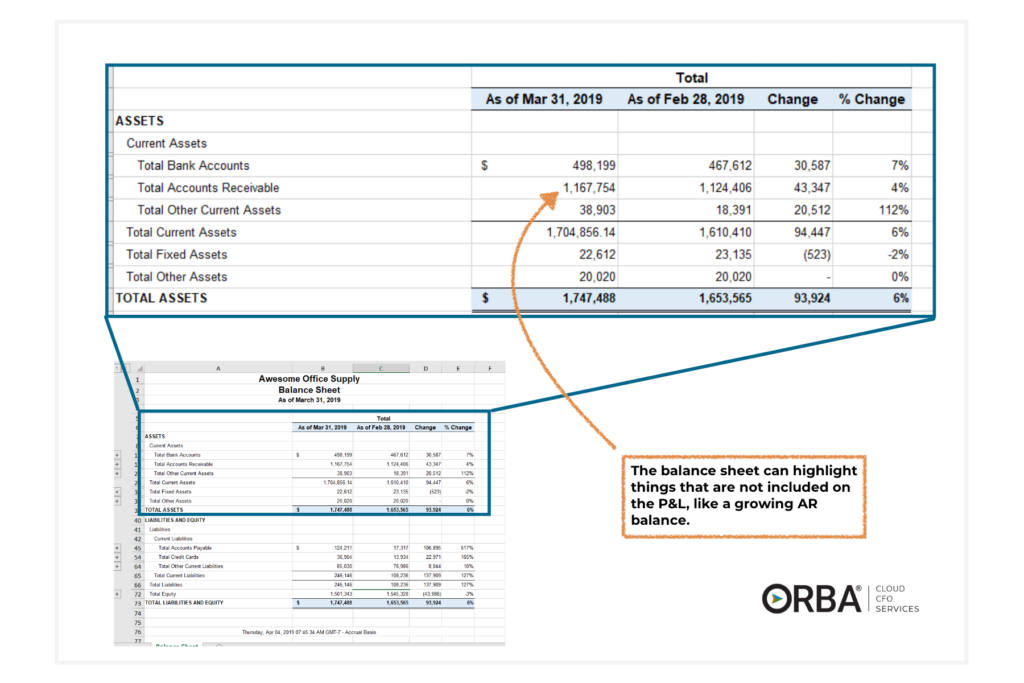
Example 1: Holding onto a big accounts receivable balance
If your company has a huge accounts receivable (AR) balance, on paper you could be making money, but in reality you don’t actually have the cash yet.
The P&L shows revenue from those sales, but does not reflect when you actually receive payment for those sales. Your balance sheet will highlight outstanding AR (i.e., you are waiting on more water yet to be added to the bucket).
Example 2: Manufacturing companies with numerous fixed assets
Companies that require a large quantity of equipment, like manufacturing companies, may have to spend a significant amount of money upfront on fixed assets. The fixed assets are taking up a lot of cash, which would not be reflected on the P&L. In this narrative, the P&L may look good, but the balance sheet fills in the gap. Even though expenses are not high (i.e., not much water is flowing out of your bucket), your profits may be low. The balance sheet shines light on your cash getting tied up in assets.
Example 3: Consumer goods, eCommerce and/or companies holding inventory
Inventory-heavy companies that sell a product, may have a ton of cash tied up in inventory. This could be due to any number of reasons: They have bought up too much of the wrong product, are stuck with stale product or perhaps have a few million old models of computers or an old version of software, and need to reduce inventory costs.
Your P&L hides this, but your balance sheet exposes it. The inventory will show up on your balance sheet as cash that has already been spent.
Using the FIFO versus the LIFO inventory accounting methods will affect your balance sheet and P&L differently.
The Bottom Line
Don’t forget that your balance sheet tells you how efficient business is at turning profits into cash. But the balance sheet doesn’t tell you about your revenue, income or cash flow, so should be used together with the other two reports: your P&L and your cash flow statement. All of these financial reports are important for investors or stakeholders to review to understand the value and health of your company.
Read more about troubleshooting cash flow issues, or click here to book a time with one of our experts to find out how you can put your balance sheet to work.