Customer success KPIs tell an important narrative about your ability to grow revenue and maintain a healthy cash flow. That’s right, even KPIs related to customers are rooted in your finances. Here some of the top customer success KPIs you should check in with on a regular basis.
(Plus a few others worth an honorable mention).
Top 10 Customer Success KPIs
We often get asked by clients how to capture the cost of acquiring customers. But, we believe your customer acquisition cost is just one part of the true cost to value ratio of customers and ultimately measuring customer success.
Here are the acquisition and customer success KPIs I believe can focus your efforts on your most valuable customers. Sayonara to those costing you more time than they’re worth!
Customer Acquisition Cost
I would be neglecting a tried an true customer-centric KPI if I didn’t touch on your customer acquisition cost. Let’s give this one the first “honorable mention.”
Your customer acquisition cost (CAC) is the the total cost to acquire one new customer.
Think of it this way: CAC is the amount of money you need to invest in order to win one new customer. When coupled with the profit you expect to receive from that customer, you can decide whether or not it makes sense to continue investing in that customer acquisition channel. Of course, a big focus of your marketing team should be on how to lower customer acquisition cost.
1. Conversion Rate
Conversion rate measures how many leads are moving to the next stage of your sales funnel. It is an important business development KPI and can highlight where you need to fix a leaky funnel.
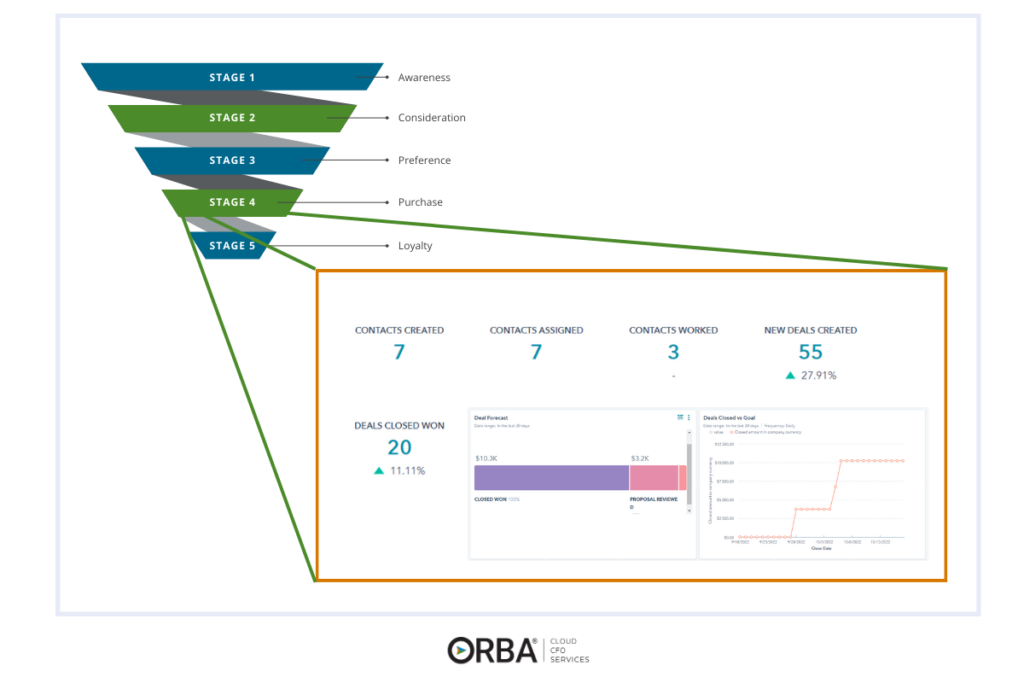
Conversion rate = #of customers in current stage/# of customers in first stage
Low conversion rates indicate leaks in your funnel where you may be losing leads. A high conversion rate suggests your sales process is working effectively.
2. Customer Lifetime Value
When you’re examining customer profitability, there are two key methods where you can focus your efforts on growing: Increase the number of customers or, alternatively, increase the customer lifetime value (LTV).
Customer lifetime value is the value given to the estimated profit gained from a customer or client during their “lifetime” as your customer.
Customer Acquisition vs Retention
Your customer LTV tells an important story about the value you offer customers and how valuable they are to your company.
Remember, it’s almost always better for your bottom line to retain one customer than it is to acquire a new one.
Many marketers know that it’s better to extend the lifetime of your current customer base. And yet, many companies still spend a significant amount more on acquiring new customers (which also does have an important role when you are trying to scale up).
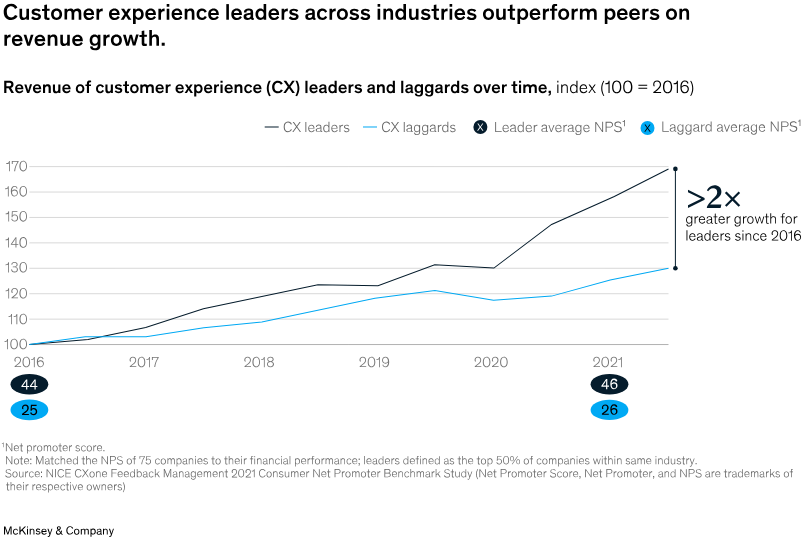
The numbers vary, and truthfully are based on some outdated studies (we’re talking 2014 or older). But Forbes still puts it at four to fives times more expensive to acquire new customers compared to retaining existing ones. And newer sources confirm that customer experience (CX) leaders outperform their industry peers in revenue growth. This is why customer success KPIs are so valuable.
A fantastic example was when a mobile telecom CEO shifted his focus into improving customer retention. How did he do this? By listening to his customers.
He eliminated contracts, allowed anytime upgrades and gave the same offers to existing customers that they were giving new ones.
The results?
They cut customer churn rates by 75 percent and in the next three-years, the company’s revenues nearly doubled—outperforming key competitors’ revenue growth. The CEO is quoted saying, “It’s amazing the things you can do when you shut up and listen to your customers.”
So, while you do want to pay heed to your CAC, it is just as important, if not more so, to consider your customer loyalty and retention metrics in understanding your true customer success.
To calculate your customer lifetime value use this formula:
LTV = MRR (Monthly Recurring Revenue) x (Gross Profit %) x (# of lifetime months)
3. Customer Churn
Another customer success KPI to pay attention to is your churn rate. If churn is high, that’s a telltale sign you need to focus on your customer service.
Churn rate analyzes how often customers discontinue their usage of your product or service within a specific timeframe.
Often seen as an important Key Performance Indicator (KPI) for Service as a Software (SaaS) business models, it is especially useful for looking at the rate at which customers end their subscriptions within a certain time. Generally, you want your growth rate to exceed your churn rate in order to scale.
For instance, are a quarter of your customers abandoning your service within a year, or do the majority continue to utilize it for an extended period of five years? It is important to assess whether this churn rate aligns with the expectations of your industry or business model. A higher churn rate than industry peers may suggest underlying issues that need to be addressed as we saw in the telecom example. Here’s a simplified version of the formula for churn rate:
Churn Rate = Lost Customers/Starting Number of Customers x 100
For example, if your business had 1,500 customers at the start of the year and lost 350 customers during the year, you’d apply the above formula as follows for a 23% churn rate per year.
350 (number of customers lost) / 1,500 (total customers at the start of the quarter) = 0.23
Cloud CFO Benchmark: Ideally, to fall into the awesome category, you’d want to aim for 20% or less churn rate per year. The time period for churn is a very important part of the value.
How to reduce customer churn
Going back to our earlier point about customer acquisition vs retention, reducing customer churn will increase your LTV and ultimately profit. There are many ways to reduce churn, and it shouldn’t just come down to loyalty programs. (Though if you’re interested in understanding more about how loyalty programs can help your net profit, check out this infographic). Identify soft skill gaps and encourage employees to tackle experience-led client/customer relations as part of their career development. If that’s not possible, consider building out dedicated customer success teams.
For example, after hearing from customers that they wanted consistency from managers that were already stretched thin, we restructured to create pods, so that a few of our most experienced managers could be the point person for both our service-delivery teams and for client relations. The pod leaders now have teams that they check in with to get a handle on the client engagement but can be more hands-off in the day-to-day accounting services. This means the pod leaders have more time to offer client relations when it really matters.
Cloud CFO Tip: One way we measure performance with our clients is to track it using a client-specific P&L assessment. Whether you’re segmenting your customer-base to identify gaps in service or building out a referral program, connecting it to a P&L statement and the associated customer success KPIs will allow you to budget accordingly. And bonus, it also drives CX performance discussions.
Finally, plan to also track your net retention rate and net promoter score to know how many of your customers are sticking around and which of those are simply one-and-done fans.
4. Net Retention Rate
To really “drive” revenue growth you should track customer retention and your net retention rate (NRR).
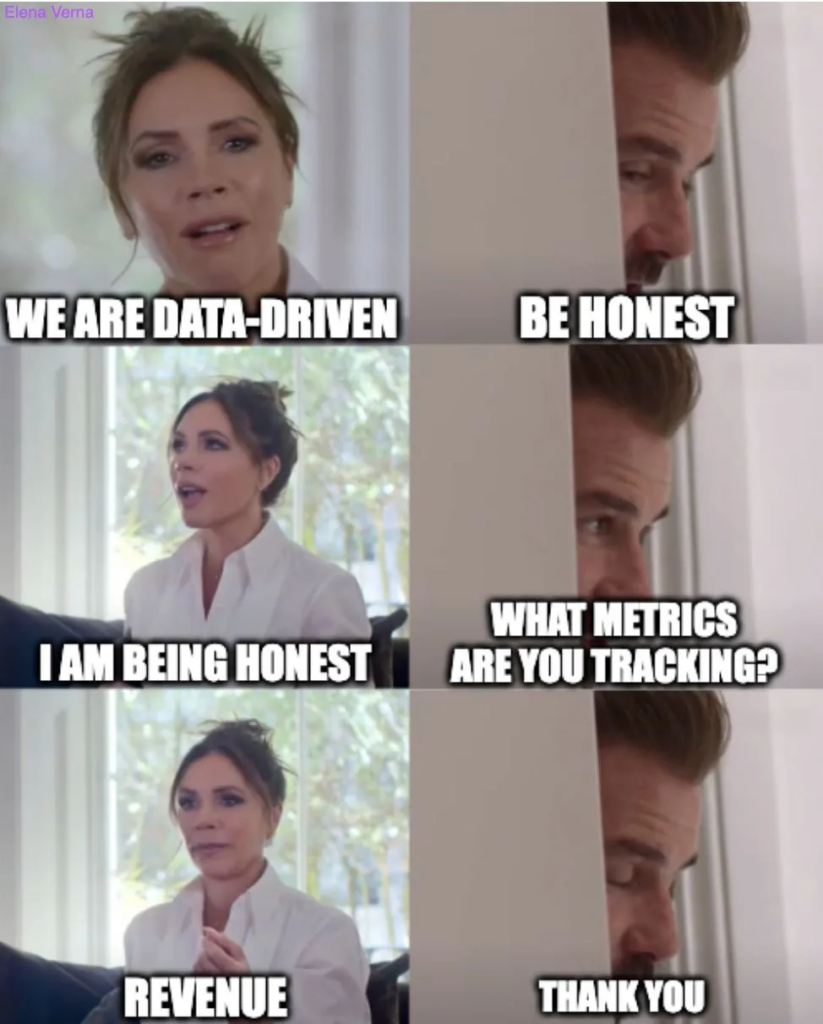
Even if you didn’t watch the Beckham special, this is such a great meme because it’s so easy to feel like we’re tracking our data, but revenue can be a bit of a vanity metric.
Depending on your business model, revenue numbers can easily be inflated on the balance sheet. This doesn’t help any business owner or CFO understand their true financial position.
Some think of retention rate simply as the opposite of churn but with a positive spin on things.
But the opposite of losing customers isn’t retaining them, it is acquiring new ones. There are some key differences from a qualitative point of view. Retention involves a more proactive approach with a focus on customer experience (CX), compared to churn which focuses on the renewal point in a customer journey. Additionally, net retention also factors in the expansion and contraction of revenue from existing clients. I think they’re both equally important to work at improving. But as we learned above, the companies that excel at CX, excel at revenue growth.
Net revenue retention = Monthly Recurring Revenue (MRR) at Start of Period+ Expansions + Upsells Churn – Contractions MRR at Start of Period
Cloud CFO Benchmark: Generally anywhere above 100% is a great revenue retention rate because it indicates revenue growth.
SaaS-specific research suggests that company growth is positively and exponentially correlated with NRR, once again, reinforcing the importance of CX to your best pathway to growth. Ways to improve your NRR include applying value-based segmentation, and assigning customer needs-based service delivery. Leading brand, Yeti is a shining example of how to lean into the post-purchase CX. Using things like your net promoter score you can identify existing customers that may be good targets for upsell or expansion of services. Finally, investing in customer success teams will secure your chances of increasing NRR.
5. Net Promoter Score
So we now know to truly understand customer value, we need to measure engagement not just customer accruals. Get a handle on your net promoter score (NPS) by running a simple survey to understand how you could do better.
Net Promoter Score (NPS) measures how likely customers are to recommend your business to a friend or colleague on a scale from 0 through 10.
- Those who rate a company a 9 or 10 are “promoters.”
- Those who give a rating of 7 or 8 are “passives.”
- Anyone who gives a rating of 0-6 is a “detractor.”
NPS was first identified as an important loyalty metric by Bain and Co, who also supplied some of those old customer loyalty stats that are so often quoted. Regardless, Bain and Co. say that companies that top out their NPS in their industry grow revenue twice as fast. Which makes this a pretty solid growth indicator.
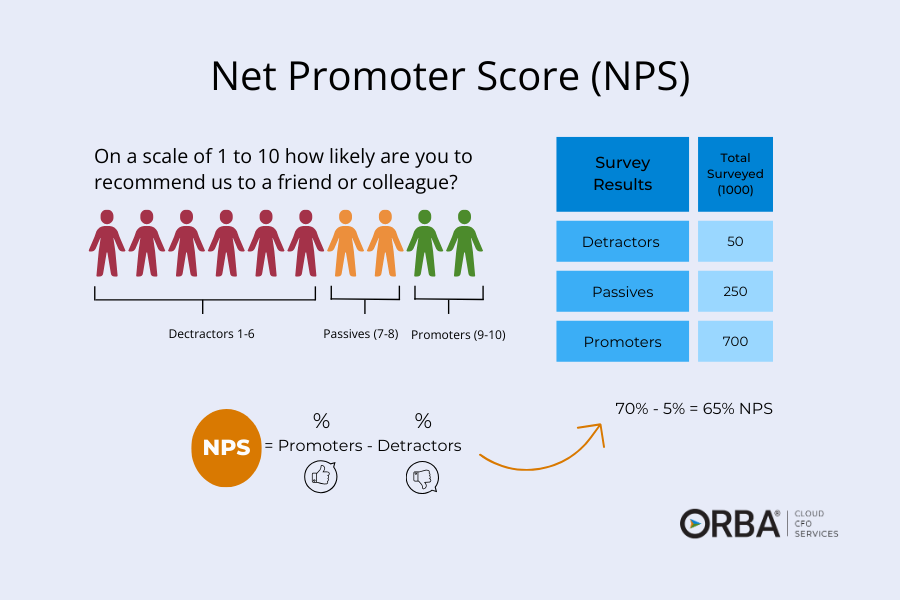
The formula for NPS is:
Net Promoter Score = % of surveyed customers who are “promoters” – % of surveyed customers who are “detractors”
6. Referral Rate
Directly linked to NPS, are your referral and referral conversion rates. In fact, if you run surveys for NPS, using your CRM to automatically ask any “promoters” for referrals is a great way to boost these customer success KPIs.
Your referral rate is the percentage of sales that came from referrals.
Cloud CFO Benchmark: Referral rates do vary across industries, with some averaging above 3% (like books, unsurprisingly). Generally, we recommend you aim for a referral rate of 2+%. You can calculate referral rate using this formula:
Referral Rate = (# of referred purchases/# of total purchases) x 100
One thing to note about this customer success KPI is that referral rate differs from referral conversion rate.
Referral conversion rate is the percentage of referred leads that become customers.
You calculate your referral conversion rate using this formula:
Referral conversion rate = (Number of referrals that become customers / Number of referrals received) x 100%
For example, if you received 100 referrals in a month and 30 of them became customers, your referral conversion rate would be: (30 / 100) x 100% = 30%
7. Payback Period
It is our favorite forgotten metric: your Payback Period (PBP). You can dive into more detail in this post, but it’s similar to inventory turn.
Your Payback Period (PBP) is the length of time required to earn back the cost of your investment.
A shorter PBP means more profit cycles within a specific time period. This means less capital needed to fund your growth.
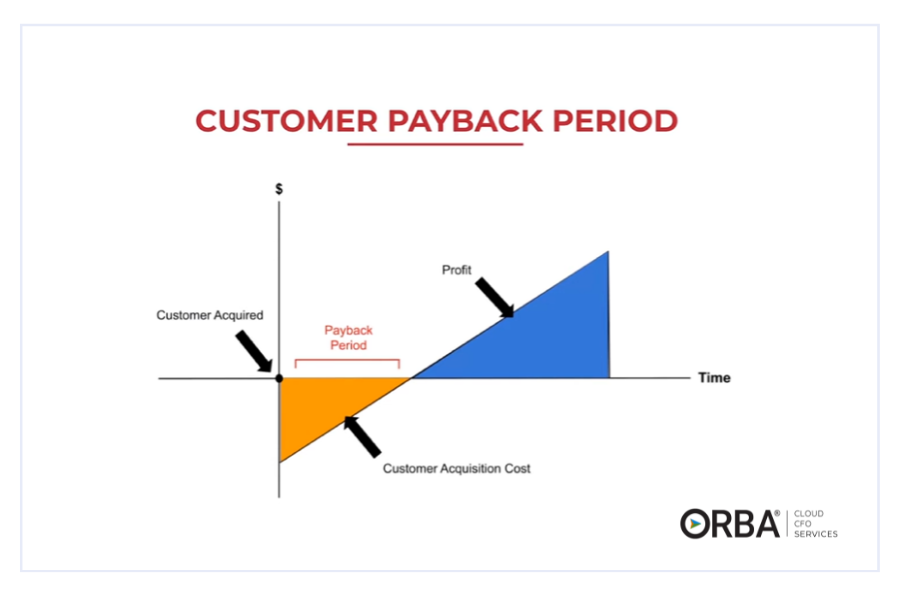
Cloud CFO Benchmark: A key takeaway is to keep your PBP at 12 months or less. Meaning if a PBP is 12 months, it took you 12 months to recoup your costs for that customer.
Payback Period (PBP) = CAC / (monthly revenue x gross profit %)
Take Dropbox as an example: Why do they offer a 20% discount to pay upfront for a year? They have a better PBP if they get the cash immediately versus waiting for 12 months to receive all of your monthly payments.
8. Recurring Revenue
Recurring revenue is an awesome type of sale to go after whether you sell products or services. Since the introduction of streaming services we’ve seen a shift in how businesses think about recurring revenue. If you have some sort of consistent, recurring revenue you can deliver predictable income. Plus, according to Zuora, subscription-based companies have grown 3.7 times faster than companies in the S&P 500 in the last 11 years.
To excel as a subscription-based business, you should focus on acquisition, retention and expansion.
With a growing market size of over 650 billion dollars, considering how to capture a piece of the subscription economy is just smart business planning. Whether it’s SaaS, media or health products, many companies are diversifying to create recurring revenue streams.
Monthly Recurring Revenue (MRR) is your recurring revenue from all customers on a monthly basis. Does not include one-time fees like setup or installation.
Annual Recurring Revenue (ARR) is your recurring revenue from all customers on an annual basis. Does not include one-time revenues.
Another way to use this metric is to look at your ARR growth YoY and compare it to budgeted growth.
9. SaaS Magic Number
Use this customer success KPI by looking at your ARR from the current period compared to the preceding period and dividing them by your sales & marketing costs. Referred to as the SaaS magic number, this tells you a lot about your sales & marketing performance. This is another metric that, alongside the Rule of 40, makes sense to check in with a couple times each year, (especially if you’re in the SaaS industry).
SaaS Magic Number = ((Current period’s revenue – Previous period’s revenue) x 4) / (Previous period’s sales and marketing spend)
Cloud CFO benchmark: Aim for a SaaS Magic number ratio over 0.75. Once you consistently maintain that, it’s time to invest in Sales & Marketing (S&M)
| SaaS Magic Number Ratio | What it means? |
|---|---|
| < 0.5 | Do not invest more in S&M |
| <0.75 | Dig in and evaluate your ARR for trends and whether it’s time to focus more on S&M |
| >0.75 | Invest in S&M |
10. Average Revenue per Account
You may also want to track your average revenue per account (ARPA) growth. To calculate ARPA use this formula
Average Revenue per Account (ARPA) = Total ARR / # of Active Subscribers per year
You can use ARPA to assess
- The effect of other customer success KPIs like customer lifetime value (LTV)
- S&M pipeline metrics, such as customer acquisition cost (CAC)
- Customer segmentation
- Revenue forecasting
That said, generally NRR is a more telling metric of company growth and expansion.
The Bottom Line
Growth = Better CX.
Ultimately, if you want to master YoY growth you should be employing these customer success KPIs (or at least the most relevant ones) and reviewing them on a monthly and/or quarterly basis. Need help setting up the financial reporting to track these metrics? Learn more about our outsourced CFO services.